A debate has been raging among boaters for some decades about whether paper charts or electronic charts are more reliable and accurate. In recent years, those on the electronic side of the fence have appeared vindicated, as NOAA has gradually phased out – or “Sunsetted” in their terms – the raster data set used to print paper charts. As boaters have leaned into the electronic charts (whether on chart plotters or mobile devices) many have frequently gotten spooked, as objects – or even their own boat – either disappeared or tracked in an obviously wrong place.
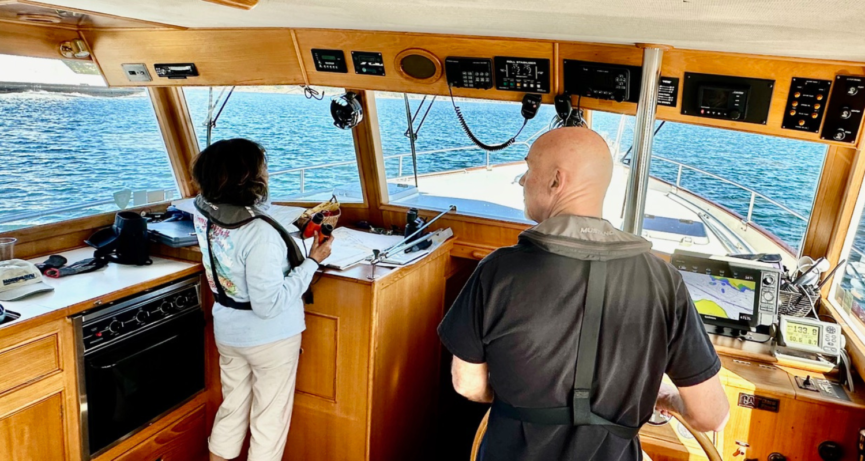
Last spring, on a 46 foot Grand Banks, we were piloting through a particularly narrow passage in BC, when our boat’s position on my screen started jumping around. It was quite scary as there were underwater rocks on both sides of the boat. Fortunately, I have a very strong ability to visually read the land and water around me, to gauge my position relative to the chart data. Many boaters don’t have that ability well enough developed, and those (usually especially inexperienced) who think they do, often find out the hard way that they don’t.
Even better, my students who were actually piloting the boat, had both an updated chart plotter and an even more up-to-date paper chart at their disposal, and were practicing their training in that crucial skill of “eyeball navigation”. I quickly ditched the iPad, which beheld the version of our boat that was jumping around, and continued my observations from behind the crew with reference to the other two sources.
My iPad experience has been corroborated by countless other boaters during my presentations on this topic. Some also noticed their little boat on an iPad screen floating out to nether locations. Others shared tales where their vessel’s chart plotter location was clearly way off track in a place they know well. (What happens when it’s not a location you know well?!) These occurrences appear at consistent locations or randomly, or somehow associated with known objects (underwater cables?), or completely mystifying.
Now before you plug me as a “paper dinosaur”, let me be clear on just how much I appreciate electronic charts, with their GPS location abilities, tools and tricks that help account for the effects of currents and winds, and the mass of data packed behind what we see on the screen – which is at our fingertips to summon as needed. I always use electronic charts, along with any other tools at my disposal. So why DO I cling to my paper charts, along with the majority of experienced boaters who attend my presentations? Let’s cut to the chase and enumerate a few of the weaknesses that counterbalance the strengths of electronic charts:
- Astute navigators observe that – unless you are zoomed to the exact right scale on your chart plotter – many of the navigation aids and rocks are simply invisible. Because the screen size is limited (even the biggest ones), zooming in means much of your surroundings are out of the screen. But upon zooming out the chart plotter makes many objects and navigation aids disappear, so as to limit clutter on the screen.
- Boaters tend to default to the assumption that their electronic charts are completely current because, well, they’re electronic – they’re on a computer screen! Alas I’ve seen many discrepancies as I have gone from boat to boat training owners. The December 2022 issue of BoatUS Magazine revealed that even those who frequently update their chart plotter don’t actually know how current the provider’s database is. Journalistic investigation led the author (Tim Murphy) to conclude that many manufacturers themselves were unable to provide this information, and their data sources were often many months out of date.
- GPS jamming and spoofing are growing threats to those who rely on location data – including military vessels & aircraft, merchant ships, recreational boaters – and even everyday cellphone users. Look it up – and don’t even pretend to assume there are no bad actors in the areas you boat in. Nobody knows when, where and why they will pop up.
- The list goes on… choose your own (mis)adventure.
At Shearwater University we have not ditched our GPS chart plotters any more than we’ve ditched our paper charts. They both have their benefits and limitations. Therefore, we are squarely on “both sides of the fence” – leveraging the complementary advantages of both paper and electronic charts at all times when we are navigating and piloting a boat.
“But you said NOAA has been ‘sunsetting” the paper charts data!’, you cry. To be clear, they have sunsetted the raster chart data. These are bitmap images that don’t reveal added detail as you zoom in. Nor have they the ability to store data behind the image to the degree that electronic navigation charts (ENCs) can. But, it turns out, you can print ENCs. In fact, the paper chart my students were using on the Grand Banks 46 was known to be more up-to-date than the vessel’s chart plotter ENCs. Nobody knows better than NOAA, the US primary source of official chart data, that the capabilities of ENCs are limited, and that safe boating relies on both electronic and paper charts. In fact, they have been hard at work for years building the best “Custom Chart Tool” in the world. Paper charts have never been better.
This is why I can confidently say that the paper chart my students were using was more current than the electronic chat plotter chart. All chart plotter manufacturers build their chart images based on the NOAA ENC data set (primary source). NOAA’s data is updated at least weekly. Chart plotter manufacturers must in turn periodically update the data on their servers from NOAA servers. Vessel operators can then subsequently update their personal chart plotters. In contrast, our paper charts on the Grand Banks were created by me, directly from the NOAA data base using the online NOAA Custom Chart Tool, and printed by my local print shop the day before we cast off the lines. That’s a current chart!
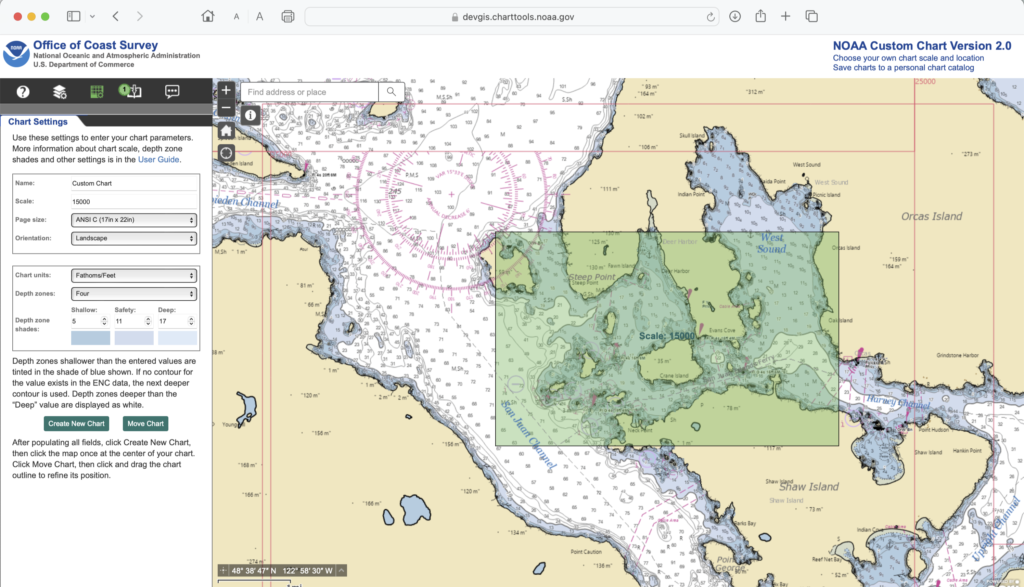
You can learn how to create your own updated paper charts using the how-to guides on the NOAA Custom Chart website (https://devgis.charttools.noaa.gov/pod), or at one of my live presentations (like this May at TrawlerFest in Anacortes), or in our Navigation Essentials class (online, on-demand).
One final note on the practices we teach for the new charting environment: I have my Custom ENC charts printed by a local printer, in full color, on blueprint paper. That makes them very inexpensive (if it’s expensive, you’re at the wrong printer). Make sure the print is high quality, or it is not suitable for navigation (find another printer). I export and print my set of charts for a given cruise very close to our cast-off date, so they are as current as possible. During the cruise we mark them up liberally to aid our safe piloting. At the end of that cruise I consider them fire starter (or cruise mementos). I then make a fresh, custom, updated chart set just before the next cruise, and unique to that cruise. Happy boating is safe boating. I wish you both.